
Wave
Structure
Objective client focused research for direct broker integration
Est. 2014
Copenhagen, Denmark
WaveStructure (WS) provides daily analysis and ratings to investment management and sell side firms. Our services help investors make better decisions with unbiased, insightful and risk-appropriate quantitative models across 7 asset classes. WS company culture is founded on consistency, predictability and transparency.
“Truth is ever to be found in simplicity”
— Sir Isaac Newton
— Sir Isaac Newton
Full lifecycle customer engagement
Research and innovation
The in-house developed wave identification software is based on academic research and monitors over 1500 tradable instruments daily. Specific repeatable patterns with validated statistical significance get distributed through client channels as soon as they get identified.
The core of WS analysis is to identify cyclical Elliott Wave patterns. These wave structures are then processed by a secondary layer of analysis to produce each of our event signals.
4 main event classes
0-4 Line break:
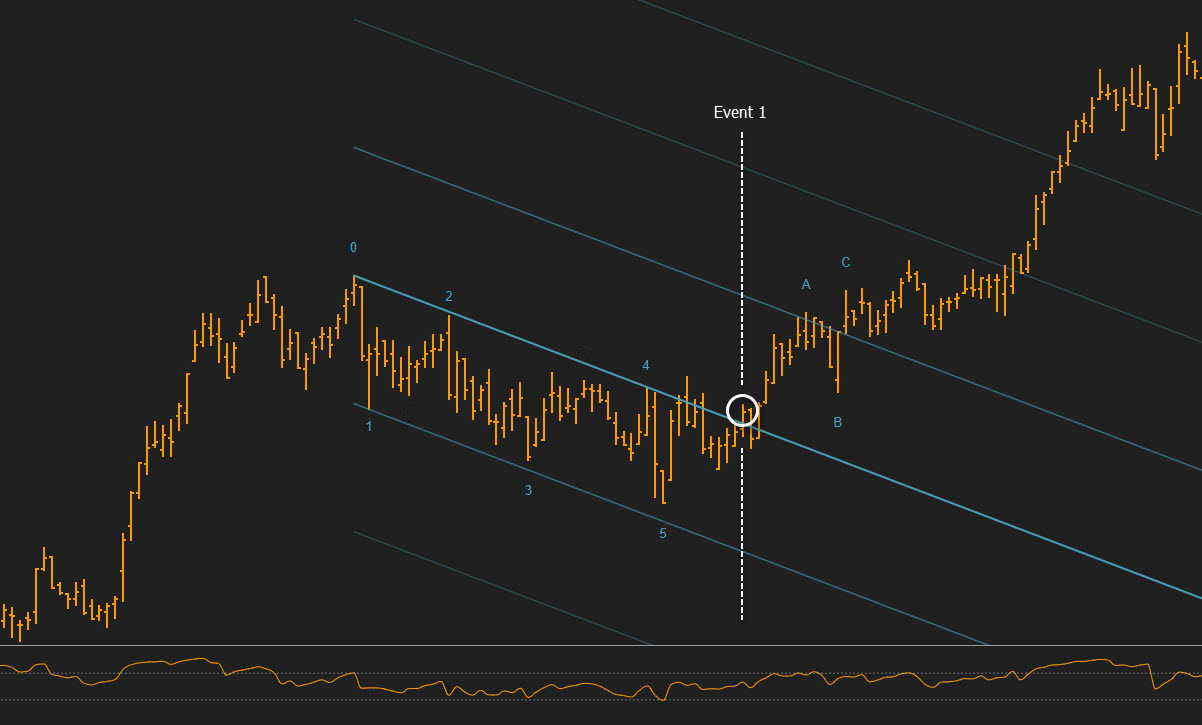
Our flagship event tracks breaches of the lines connecting Elliott Waves 0 and 4. It is often used as a key leading indicator for change in trend direction and an opportunity for an early and low risk entry. (Event 1 chart)
Bullish/Bearish Divergence:
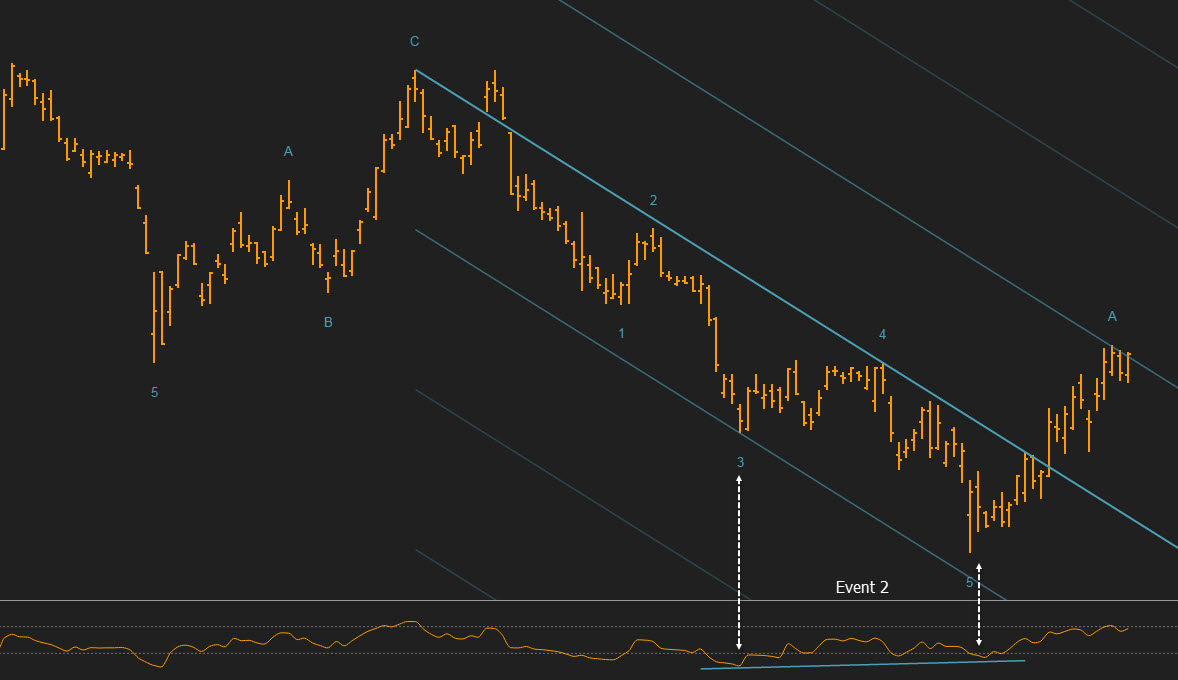
While divergence alone does not provide enough confirmation to act, it calls for alertness and practitioners often use it in combination with other signals as an early indication of trend exhaustion. (Event 2 chart)
Break of Wave 1:
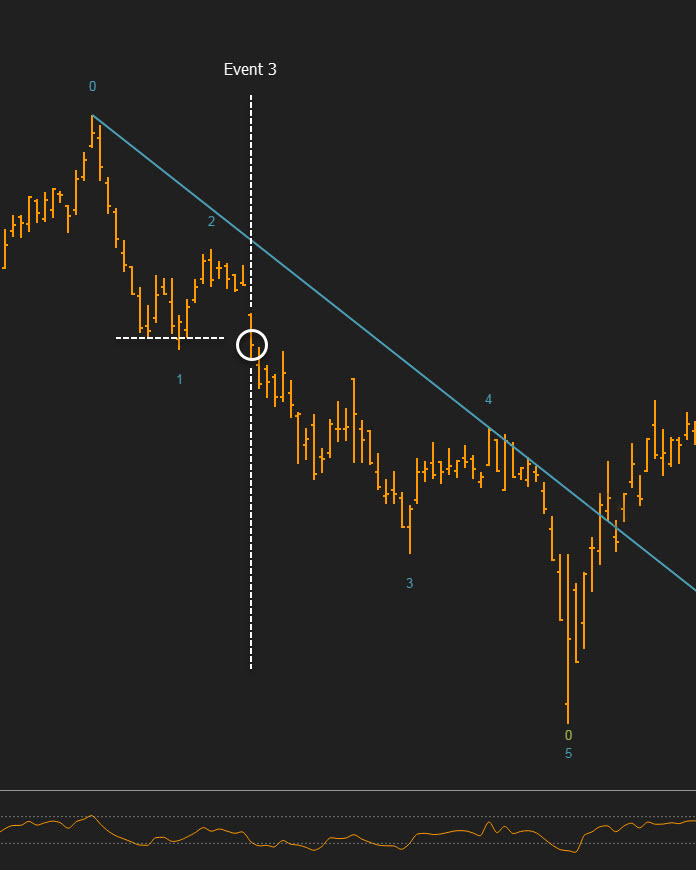
The prime setup followed by classic Elliotticians. Price entering the territory of wave 3, the most impulsive and usually longest wave, is regarded as a favorite juncture to pay attention and take action. (Event 3 chart)
Rating sentiment change:
A bullish or bearish change in our rating system score for a given instrument. E.g. from "buy" to "hold".
Rating system
The system compiles our future outlook taking into consideration all WS research, return expectations and risk tolerance, and outputs a (strong) buy, hold or (strong) sell rating. It is heavily inspired by Ned Davis Research practices and as such can be characterized as a component weighted model that provides a consolidated view and ties together occasionally opposing investment themes. Subscribers rely on rating changes to adjust their portfolio allocations and even evaluate their market position in the context of net sentiment fluctuations.
Why our clients work with us
“Of all the kinds of knowledge that the West has given to the world, the most valuable is the scientific method.”
Grow your business by helping your clients
- Alleviate stress by introducing structure and predictability in your customers' investment decision process.
- Curb herd-following predisposition and emotional investment impulses.
- Demonstrate genuine, repeatable patterns that promote discipline.
How we are different compared to other providers
- Explicitly scientific approach producing 100% repeatable, objective and empirically testable research.
- No repainting. Once our wave counts are completed they never change.
- Clear-cut notation that is easy for practitioners to understand and apply.
Broker integration
WS provides various integration methods and tailors each instance to the specific needs of the broker. Several "plug and play" methods for accessing WS signals, charting platform and education section are readily available. In special cases we work closely with partners to develop direct integration of our analysis on their own charting platform.
{
   "date": "20XX-09-28",
   "group": "US Equity",
   "ticker": "NFLX:US",
   "period": "Daily",
   "name": "Netflix Inc",
   "event": "0-4 line break",
   "sentiment": "Bearish",
   "url": "https://www.wavestructure.com/view/?symbol=HYG&period=D&key=xxx",
   "comment": "Upsloping 0-4 line breached. A bearish move is expected to develop. Expect price to (...)"
},
{
   "date": "20XX-09-28",
   "group": "EU Equity",
   "ticker": "NOVOB:DK",
   "period": "Daily",
   "name": "Novo Nordisk A/S",
   "event": "Wave 1 break",
   "sentiment": "Bullish",
   "url": "https://www.wavestructure.com/view/?symbol=NOVOB:DK&period=D&key=xxx",
   "comment": "Entering Wave 3 territory. Prices are expected to rise in a sharp (...)"
}
Get in touch
Contact us to get demo access to our platform or schedule a meeting.
© WaveStructure. All rights reserved.